PE Procurement 2026: Why Delivery Timing Now Beats the Lowest Price
July 2026 reset PE buying: tanker attacks, Brent +22%, freight ≠ delivery risk. How to buy on landed cost and delivery certainty — with an RFQ delivery sheet.

Pedro Zaccaria
Chief Technology Officer


New here? The background is the Hormuz Crisis series — Week 1 | Week 2 | Week 3 | Week 4 | Week 5 | Week 6 | Week 7. This one is a standalone procurement guide, not Week 8.
Two numbers from the last week of July 2026. On July 30, Drewry’s World Container Index slipped 3% to $4,255 per forty-foot container. On July 23, ten ships crossed the Strait of Hormuz in twenty-four hours, against a pre-crisis baseline of 88 a day.
Container freight got cheaper. Getting a cargo of polyethylene onto your extruder got harder. Same week.
That combination caught buyers out in July, and it changed the question. Through the first half of 2026 the market ran on one: what is the price? By the end of July the buyers who were still fully supplied had swapped it for a harder one. Where is the cargo, and when does it berth?
June had given everyone a reason to relax. A memorandum signed on June 15 called for the strait to reopen without Iranian tolls for at least 60 days, and by July 1 Maersk, Hapag-Lloyd and CMA CGM were putting vessels back through the Gulf, using what the carriers treated as a narrow security window. Offers softened. Buyers went back to shopping on unit price.
That lasted six days. Early on July 7 a projectile struck the Qatari LNG carrier Al Rekayyat roughly eight nautical miles off Limah, Oman — the first Qatari LNG carrier hit since the war began, with the crew evacuated. A Saudi-flagged crude tanker was damaged in the same period. The joint maritime threat level for the strait was raised to “severe” — the grade that means an attack is highly likely.
None of that shows up in a freight index. It shows up weeks later, on the day the cargo was supposed to clear customs and feed a line that is already running on safety stock.
If you buy resin for a converting operation, the practical effect is narrow and expensive. When a cheap offer and a defined arrival window do not come in the same email, the discount is a risk transfer, and it only pays off if nothing between the load port and your gate goes wrong. In July, plenty went wrong.
In July 2026, the deciding variable in polyethylene procurement moved from unit price to delivery certainty. Feedstock costs whipsawed, container spot rates fell on major lanes, and delivery risk rose at the same time. Buying on landed cost and a confirmed arrival window, rather than on the lowest FOB quote, is what now protects a converter’s margin.
What follows is a buyer’s guide rather than a war report: the six risks hiding behind a falling freight number, the landed-cost math that prices them, a delivery sheet you can paste into your next RFQ, and a sourcing map for the rest of 2026. The July timeline comes first, because it explains why the rest of it matters.
Key Takeaways — July 31, 2026
- The Strait of Hormuz threat level was raised to “severe” on July 7, 2026 after three vessels were attacked, including the Qatari LNG carrier Al Rekayyat. “Severe” is the grade that means an attack is highly likely, and carriers price accordingly.
- Daily transits fell to 10 vessels by July 23 — 34 on July 5, 14 on July 13, 15 on July 19, 10 on July 23 — against an 88-a-day pre-crisis baseline tracked by IMF PortWatch. That is a slide through the whole month, not a two-day shock.
- Brent closed above $100 for the first time since May 26 — $100.69 on July 23, up 7% on the day — then traded as low as $82.82 intraday on July 28 and rallied 7.9% to close at $90.74 on July 29. Even after the round trip, Brent is up roughly 19.6% month on month.
- Japan naphtha reached $782.27/t on July 29, up 8.04% in a single day and about 27% on the month (cbonds index). Producers moved with it: Reliance raised Indian HDPE by ₹2,000/MT and LLDPE/LDPE by ₹5,000/MT effective July 27.
- Spot freight fell while the bill went up. Drewry’s WCI dropped 3% to $4,255/FEU on July 30 in the same week CMA CGM set an Emergency Fuel Surcharge of $75–$165/TEU from August, explicitly tied to renewed Hormuz hostilities.
- Global container schedule reliability was 62.6% in June 2026, and late vessels arrived an average 5.31 days behind schedule (Sea-Intelligence). Gemini Cooperation hit 93.4%; Premier Alliance managed 53.6% — a 40-point swing that makes carrier selection an RFQ line item, not a shipping-desk afterthought.
- War-risk hull insurance for Hormuz transits ran 3–10% of hull value against a 0.25% pre-war baseline — roughly $250,000 becoming $3–10 million on a $100 million tanker, according to Marsh’s global head of marine. That cost reaches your invoice through freight and surcharges, never through the resin price.
- Customs exams, demurrage, congestion surcharges and receiving costs can add 3–8% on top of an FOB price, and inventory carrying cost runs a realized median near 10% of inventory value per year (APQC benchmarking). Both hit your P&L; neither appears on the quotation sheet, and the second is what inventory financing is really paying for.
- China exported about 550,000 t of PE in April 2026, up 164% month on month and 479% year on year (ChemOrbis), with Latin America taking 128,000 t in January–April, up 107% year on year. New origins are available. An origin is still not an arrival date.
What Changed in the PE Market in July 2026
Delivery certainty repriced. A June 15 US–Iran memorandum reopened the Strait of Hormuz, and carriers moved ships back through on July 1. Six days later three vessels were attacked, the threat level went to “severe,” and daily transits fell to 10. Cargo that could prove its position outpriced cargo that could only prove a number.
Here is the month, dated. Watch the third column: none of it appears on a quotation sheet, which is exactly why a quotation sheet stopped being enough.
| Date | Event | What it did to delivery risk |
|---|---|---|
| Jun 15 | Trump–Pezeshkian memorandum calls for full reopening of the Strait “without tolls by Iran for at least 60 days” (CNN) | Buyers relaxed. Forward-arrival cargo priced almost level with prompt material |
| Jul 1 | Maersk, Hapag-Lloyd and CMA CGM move vessels back into the Gulf through a narrow security window, transiting successfully (WorldCargoNews) | Liner schedules briefly credible again |
| Jul 7 | Qatari LNG carrier Al Rekayyat struck ~8nm off Limah, Oman; a Saudi-flagged crude tanker damaged in the same period; UKMTO logs a third attack (Insurance Journal) | Every polyethylene parcel routed west of Hormuz became a dated liability |
| Jul 7 | JMIC/UKMTO raise the Hormuz threat level from “substantial” to “severe” — attack highly likely (Seatrade Maritime) | Underwriters reprice; owners re-route or hold |
| Jul 5–23 | Daily transits fall 34 → 14 → 15 → 10 against an 88/day pre-crisis baseline (IMF PortWatch data, via Outlook India) | A continuing collapse, not a dip. Sailing dates stop meaning arrival dates |
| Jul 17 | War-risk hull cover for Hormuz transits quoted at 3–10% of hull value, against a 0.25% pre-war baseline (Marsh, via The National) | A $100M tanker’s premium goes from ~$250K to $3–10M per voyage |
| Jul 20 | Dark transits — transponders off — reach ~70% of Hormuz movements, up from 54% and 42% the two prior weeks (Lloyd’s List) | Tracking a cargo you paid for gets harder |
| Jul 30 | CMA CGM CFO Ramon Fernandez tells the Q2 call the carrier still has eight vessels unable to exit the Strait (WorldCargoNews) | Boxes booked in May are still inside the Strait |
Those rows are one trend, not eight headlines. Non-Iran-linked transits fell from 108 to 25 in a single mid-July week, total traffic down roughly 90% year on year, with neither a VLCC nor an LNG tanker crossing on two days of that week, per Lloyd’s List data reported by CNBC. At least nine ships were attacked after July 6; the UN’s IMO documented eight hit between July 13 and 20.
The people who price this risk for a living are not describing a shock that already peaked.
“War-risk rates have moved as risk has moved. … It would have to be described as variable, given the continuing volatility.”
— Neil Roberts, Head of Marine and Aviation, Lloyd’s Market Association, The Star, July 11, 2026
Variable is the operative word for your purchase order too. A premium that swings between 0.25% and 10% of hull value inside four months is not a line item a seller can quote you six weeks forward with any conviction — which is exactly why sellers stopped trying, and started charging for certainty instead.
Why are PE buyers paying a premium for near-term shipment?
Because an on-water cargo has already survived the part of the journey that is failing. Product loaded aboard a vessel with a confirmed sailing and a fixed laycan carries a verifiable arrival window. A near-term shipment — contracted to load within weeks but not yet on board — still faces loading-port delay, laycan slippage, or outright cancellation.
Every risk in the table above sits on the pre-loading leg. Once the box is on the water, the underwriter has already been paid, the routing decision is already made, and the vessel is already past the chokepoint or was never going near it. What you buy with the premium is the removal of a variable, not a better molecule.
We tracked the mechanics through the spring, and the conclusion has not changed. Iran’s partial “friendly nations” opening in March, covered in Week 4 of the crisis series, and Dow’s 275-day unwind estimate in April, covered in our reopening analysis, both made the point June’s memorandum tempted the market to forget: a reopened strait is not a delivered pallet. The buyers who repriced fastest in July were the ones whose freight forwarder could answer “which vessel, sailed when, arriving where” in an afternoon.
The Feedstock Floor: Crude Whipsawed, PE Offers Did Not
Brent moved roughly $18 a barrel in six sessions at the end of July 2026, and PE offers barely acknowledged it. Crude closed above $100 on July 23, printed $82.82 intraday on July 28, then rebounded to $90.74 the next day. Naphtha and Chinese PE futures spent that same stretch going one way: up.
Delivery risk was only half of what moved in July. The other half was the number underneath the offer, and there the path matters more than the endpoints. Brent settled at $100.69/bbl on July 23, up 7% on the day and its first close above $100 since May 26, after Houthi strikes on two Saudi tankers in the Bab el-Mandeb and a drone strike that suspended loadings at the CPC terminal on the Black Sea — three export corridors hit at once, not one, per CNBC.
Then it broke. Brent went $97.04 on July 24, $90.43 on July 27, $89.08 on the morning of July 28 and $82.82 intraday that afternoon — a 16% retreat from the peak as US–Iran talks appeared to gain traction, reported The National. It lasted about a day. IRGC ballistic missiles were fired at US forces that same evening, all intercepted, and Brent closed July 29 up 7.9% at $90.74 (CNBC). On July 30, with US Central Command running a heavy wave of retaliatory strikes, it traded $88.93–$92.65 (Bloomberg).
What repriced over those six sessions was diplomatic sentiment, not physical risk. The dip tracked talks; the reversals tracked new shocks. If you fixed a resin price off the July 28 screen, your number was stale before the next session opened.
“I suspect that a move to $100 is quite possible, should it become apparent that physical shortage risks are real and increasingly likely.”
— Bart Melek, Global Head of Commodity Strategy, TD Securities, Al Jazeera, July 14, 2026
Nine days later, Brent printed $100.69.
| Marker | Level | Change | Date | Source |
|---|---|---|---|---|
| Brent crude — peak | $100.69/bbl | +7% d/d; first close above $100 since May 26 | Jul 23 | CNBC |
| Brent crude — trough | $82.82/bbl intraday | −16% from the Jul 23 peak | Jul 28 | The National |
| Brent crude — rebound | $90.74/bbl close | +7.9% d/d | Jul 29 | CNBC |
| Brent — month-on-month | live series | +19.6% m/m, +22.9% y/y after the pullback | end-July | TradingEconomics |
| Japan naphtha (cbonds index) | $782.27/t | +8.04% d/d; +26.8% over the past month | Jul 29 | cbonds |
| China PE futures | ~7,700–7,800 CNY/t | roughly +12% m/m | late July | TradingEconomics |
| Reliance (India) PE list | HDPE +₹2,000/MT; LLDPE and LDPE +₹5,000/MT | producer increase, after crude turned down | eff. Jul 27 | Plastemart |
| EIA Brent forecast, Q3 2026 | $74.03/bbl | full-year cut to $81.91 from June’s $95.39 | Jul 7 | EIA STEO |
Will PE prices fall now that Brent corrected?
Not on July’s evidence. Crude sets the floor under a cracker’s economics, not the offer on your quote sheet. Japan naphtha rose 26.8% over the past month to $782.27/t, China PE futures ran about 12% higher month-on-month, and Reliance raised Indian PE prices effective July 27 — after crude had already turned down.
Sellers are behaving accordingly. In Vietnam, import LLDPE offers were “standing their ground even as buyers pull back from the table,” with suppliers showing little inclination to budge, Commoplast reported on July 30. Two days earlier the same service noted China’s PE imports had plunged to a new historic low while domestic output held steady — thin import cover is not a backdrop that invites discounting.
The official forecast makes the gap visible. The EIA’s July Short-Term Energy Outlook, published July 7, put Q3 2026 Brent at $74.03/bbl and cut the full year to $81.91 from June’s $95.39 — and the market traded $100.69 sixteen days later. The distance between the official number and the printed one is the risk premium you are actually paying for, and it never appears on a line labelled “resin.”
This divergence has form. In March, Brent corrected 23% from its $126 peak and US producers doubled their April PE nomination anyway, which is the subject of Hormuz Crisis Week 4; the same round trip from $120 to sub-$90 in Week 2 did nothing for physical availability either. Crude reprices in seconds. Polyethylene reprices in shipments, and a shipment takes weeks.
So the floor holds. The variable that decides your cost this quarter sits on a vessel, not on the crude screen.
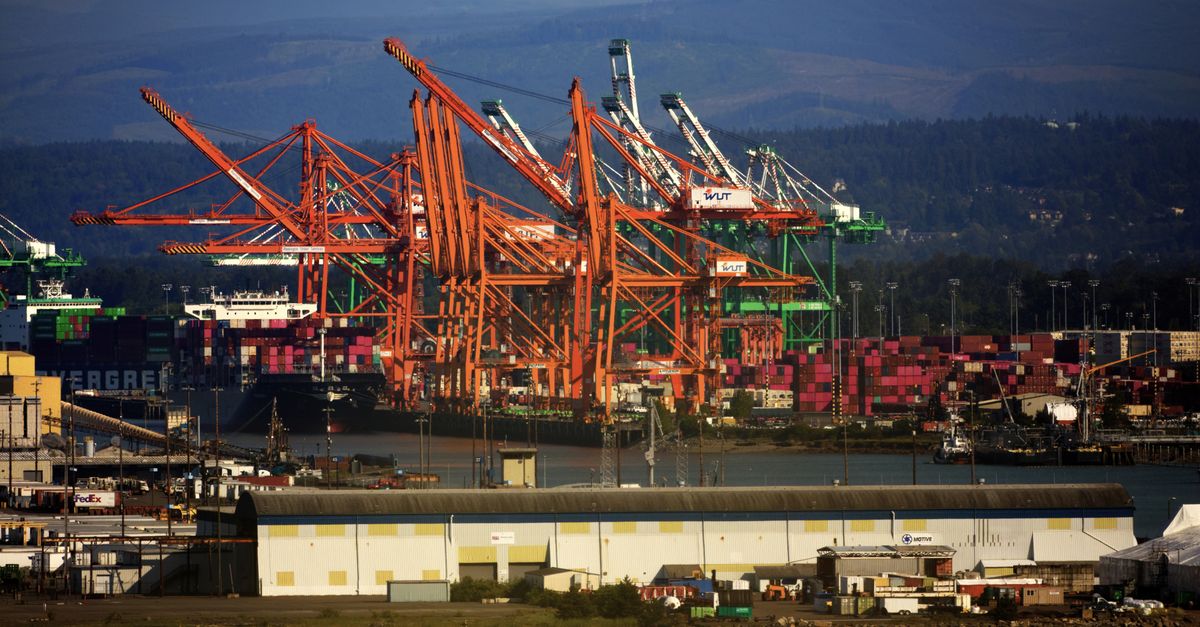
Low Freight Rates Are Not Low Delivery Risk
A falling freight index measures what carriers charge for space, not whether your cargo lands. Drewry’s World Container Index fell 3% to $4,255 per 40-foot container on July 30, 2026, while global container schedule reliability sat at 62.6% and carriers filed emergency fuel surcharges for August. Cheap space, expensive arrival.
The softening is real and broad. Drewry’s July 30 print put Shanghai–Rotterdam at $4,677/FEU (−3%), Shanghai–Genoa at $5,630/FEU (−6%) and Shanghai–Los Angeles at $5,739/FEU (−2%), with Shanghai–New York flat at $7,578/FEU. Freightos read the same direction on July 29: Asia–North Europe at $5,575/FEU (−3%), Asia–Mediterranean at $6,697/FEU (−2%).
Read the reasons Drewry gives and the relief evaporates: softening demand, a slowdown in front-loading, new US tariff measures, and eight blank sailings scheduled on the Transpacific for the following week, up from seven. Two weeks earlier the index stood at $4,547/FEU and had just ended ten consecutive weeks of gains. Demand is what came off. Risk did not.
The same July 30 note flags what is arriving in place of the decline: emergency fuel surcharges effective August. CMA CGM had already published one — $75–$165 per TEU, effective August 2026, “until further notice” — tied explicitly to renewed Hormuz hostilities.
“Following the renewed escalation of hostilities in the Strait of Hormuz over the past days, fuel prices have surged sharply again, reversing the easing observed in recent weeks.”
— CMA CGM corporate statement, AGBI, July 22, 2026
Bunker fuel at Fujairah was $813 per tonne on July 21, down from a $1,275 peak on June 12, per the same AGBI report. Fuel fell and the surcharge appeared anyway — a risk charge wearing a fuel label, landing on your invoice weeks after the index you quoted from went down.
Why can low freight still mean high landed cost?
Because ocean freight is one line on an invoice with six other lines exposed to delay. Congestion, transshipment, war-risk insurance, equipment and blank sailings, schedule changes and laycan slippage all price in days rather than dollars per container — and days are what you pay for when the silo runs dry.
| Delivery risk factor | Latest reading (July 2026) | What it does to your arrival date |
|---|---|---|
| Port congestion | Over 10% of the global container fleet waiting at anchorage on July 7 — a four-year high (Metro Global). Manila running 10–12 day vessel delays; Barcelona averaging ~2.25 days (Kuehne+Nagel) | Adds days at both ends of the voyage and is invisible in the rate you quoted. Stock held at an integrated logistics center near your plant absorbs it; a sailing schedule does not. |
| Transshipment legs | Global schedule reliability 62.6% in June, down 1.9 points month on month (Sea-Intelligence) | Every leg is a fresh chance to miss the connection. Run June’s 62.6% across two consecutive legs and the arithmetic odds of both running on schedule fall to roughly 39%. A freight forwarder that routes on leg count, not only on rate, is worth the difference. |
| War-risk and cargo insurance | Hormuz war-risk hull cover at 7.5–10% of hull value, up from a 1–3% range weeks earlier (S&P Global, July 22) | Reprices week to week and reaches you as a surcharge or a refused booking — not as a line you negotiated at RFQ. |
| Equipment and blank sailings | Eight Transpacific blank sailings scheduled for the week after July 30, up from seven (Drewry) | A blanked sailing rolls your booking to the next vessel and leaves equipment repositioned somewhere else. One rolled booking costs more days than the whole rate decline saved you dollars. |
| Schedule changes | Only 3 of 13 tracked carriers above 70% reliability; late vessels arriving an average 5.31 days behind; Gemini Cooperation 93.4% against Premier Alliance 53.6% (Sea-Intelligence) | A 40-point spread between alliances makes the carrier on your booking a bigger variable than the lane. Ask who actually operates the vessel before you compare two prices. |
| Laycan slippage | No index tracks it. It is in your contract or it does not exist | With no stated laycan there is no date the seller can miss and no remedy when they do. It belongs in the delivery sheet, next to the price. |
Even a good year does not rescue this. Global schedule reliability has run between 59.0% and 64.7% every month of 2026, per Sea-Intelligence — roughly one call in three misses its window before any crisis is layered on top. The clock also runs past the port gate: discharge, customs clearance and the inland move sit between the vessel and your extruder, each measured in days you either planned for or discovered.
Does a cheap US Gulf cargo fix a restocking gap?
Rarely. A US Gulf polyethylene cargo is useful for anchoring your price expectation and for planning a quarter ahead, but the voyage clock is long enough that it cannot cover a silo running dry in three weeks. Deep-sea supply sets your price idea; nearby stock sets your date.
That distinction decides most H2 2026 buying. Where the cargo already sits — on water with a defined laycan, in bonded stock near your market, or in a production slot nobody has run yet — moves your arrival date further than origin price does. Weighing that against a discount takes one number that holds both. The sourcing map further down works the origins; the arithmetic comes first.
What Is the Landed Cost of Resin?
The landed cost of resin is the total cost of moving a cargo from the seller’s gate to your extruder: material price, ocean freight, duties and taxes, insurance, clearance and documentation, inland delivery, and the carrying cost of the money tied up while it travels. The FOB price is one line in that stack, not the total.
Every logistics definition of landed cost builds the same stack: product plus freight plus duties plus insurance plus carrying cost. For resin the stack runs longer, because the material feeds a machine that has to keep running.
“Total landed cost includes material cost, ocean freight, customs clearance, documentation fees, and the hidden cost of inconsistent quality — think machine downtime, defects, and rejected batches.”
— PlasticsToday, “Resin Buyers Face Volatile Markets in 2026”, May 26, 2026
Before anything goes wrong, the add-ons buyers leave off the quote — exam fees, demurrage and detention, congestion surcharges, currency conversion, warehouse receiving — run 3–8% on top of the FOB price in cross-border sourcing generally. When something does go wrong, the gap outgrows the price difference you were negotiating.
FOB, CFR or CIF: which price tells you when the cargo lands?
None of them. All three Incoterms transfer risk to you at the load port, so none of them promises an arrival date. What changes between FOB, CFR and CIF is only who contracts the freight and who buys the cargo insurance — the delay is yours in every case.
| Incoterm | Who contracts ocean freight | Who buys cargo insurance | Where risk transfers to you | What it tells you about arrival |
|---|---|---|---|---|
| FOB (Free on Board) | You, through your own freight forwarder | You | On board at the load port | Nothing. It is a price at the ship’s rail, not a date at your silo. |
| CFR (Cost and Freight) | Seller | You | On board at the load port — freight prepaid does not move the risk point | Only that freight is in the number. Transit damage and delay stay with you. |
| CIF (Cost, Insurance and Freight) | Seller | Seller; you claim directly against the insurer | On board at the load port | Insurance covers lost cargo. It does not cover lost production time. |
| Under all three, import clearance, duties and the inland leg are yours — see customs clearance and transportation. Definitions per ICC Incoterms 2020 (FOB) and ICC Incoterms 2020 (CFR/CIF). | ||||
Worth knowing when you draft the contract: the ICC wrote those three for cargo loaded directly onto a vessel and recommends FCA, CPT and CIP for containers. Most resin still trades on the older three out of habit. Either way, an FOB number and a CIF number price two different scopes of work.
What does a three-week resin delay cost a film converter?
Far more than the price gap that justified the cheaper cargo. On a 500-tonne polyethylene order, a $35/t FOB saving is $17,500. One lost production shift, three weeks of extra capital tied up, the safety stock you carry to cover the window, and a late-delivery penalty erase it several times over.
The ledger below is illustrative — substitute your own tonnage and terms — but every rate in it is published. Assume a 500 t cargo valued at $600,000 feeding a $500,000 film order.
| Line item | Effect on the cargo | Rate basis |
|---|---|---|
| FOB unit-price saving vs. the on-water offer ($35/t × 500 t) | +$17,500 | Your two quotes |
| One lost 8-hour shift before a bridge cargo arrives | −$80,000 | Low end of the $10,000–$50,000/hour discrete-manufacturing downtime band, ReliaMag, 2026 |
| 21 extra days of capital tied up in a $600,000 cargo | −$3,800 | 10.98% APR, the top of the Q1 2026 small-business bank loan range, Federal Reserve |
| Three extra weeks of safety stock carried to cover the arrival window | −$8,700 | 25%/year inventory carrying cost, APQC benchmarking via Eightx |
| Late-delivery penalty on the downstream order (2% of $500,000) | −$10,000 | Your own customer contract |
| Net effect of the “cheaper” cargo | −$85,000, or −$170 per tonne | |
A cargo bought about 3% below the market landed roughly 14% above it. The two financing lines are the ones buyers most often omit, and they are not rounding errors: capital cost alone runs 8–15% of inventory value per year, larger than storage, service and shrink combined, and dedicated inventory financing spans roughly 3% secured to 30%+ APR. Arrival uncertainty is billed to your working capital whether or not anyone invoices you for it.
How to calculate the landed cost of polyethylene in six steps
Run this on every offer, on the same spreadsheet, before you compare anything.
- Fix the Incoterm before the price. Write down whether the number is FOB, CFR or CIF, and what it therefore excludes. Two offers on different terms are not comparable until step 6.
- Add freight and every surcharge attached to the lane this month. Emergency fuel and security charges are quoted outside the base rate, which is how a falling index and a rising all-in cost coexist. Ask your freight forwarder for the all-in, not the index.
- Add duties, taxes, clearance and documentation. Antidumping exposure by origin, port fees, inspection and exam risk — what your customs clearance team prices before the vessel sails, not after it berths.
- Add insurance at the rate on today’s cover note. War-risk premiums moved sharply this month, as covered above; last quarter’s rate understates the cargo.
- Price the arrival window. Days of cash tied up × your borrowing rate, plus the safety stock you carry because the ETA is a range. A supply credit line that moves payment to after your operating cycle deletes this line.
- Price being wrong. Expected delay days × the hourly cost of a stopped line × an honest probability, plus penalty exposure on the orders that cargo feeds.
Divide by tonnes and compare offers on that number alone. The math only runs if the seller hands you the inputs — origin, load port, laycan, a realistic ETA and what happens when it slips — which is what the delivery sheet below makes them put in writing.
Turn Your Resin RFQ Into a Delivery Sheet
A delivery sheet is a resin RFQ that makes the seller commit to five things besides price: origin and brand, load port and laycan, a realistic ETA at your door, payment terms, and a written delay contingency. Five extra lines turn three incomparable prices into three comparable arrival dates.
Most polyethylene RFQs still ask two questions: which grade, and what price per tonne. Three sellers answer within $20 per tonne of each other, you take the lowest, and you have learned nothing about which cargo actually exists.
The delivery sheet is that same document with a delivery column. It changes who answers: a trader with real allocation replies the same afternoon; one working from a maybe hedges every field.
What is a laycan, and why does it belong in your RFQ?
A laycan — laydays and cancelling — is the window with two dates: the earliest day a vessel may present at the load port, and the cancelling date after which the charterer may walk away or renegotiate, per Maritime Optima. In a resin quotation it is the one field that gives your seller a date to miss.
“When stating laydays/cancelling date, two aspects should be kept in mind — a) the contractual position if the vessel presents herself for loading too early, and b) the position if she cannot meet the cancelling date.”
— BIMCO charter-party guidance, as reproduced by DocShipper
“Shipment within 30 days of payment” is not a laycan. It has no cancelling date, so nothing the seller does after day 30 breaches anything, and the delay lands in your landed cost.
What should a PE quotation ask for besides price?
Five confirmations: origin and brand, load port and laycan, door ETA, payment trigger, and the remedy if the cancelling date passes. Paste the middle column into your next RFQ verbatim, and require written answers before you compare a single number.
| Confirmation | Paste this into your RFQ | What a weak answer tells you |
|---|---|---|
| 1. Origin and brand | “Name the producing plant, the producer’s brand and the exact grade code you will ship, and attach the CoA and datasheet.” | “Prime PE, Asian origin, equivalent to” means the cargo is not allocated yet. A named plant and grade code is what a trader holding real material produces in minutes. |
| 2. Load port and laycan | “State the load port, the vessel or booking reference, and a laycan with an explicit cancelling date.” | A load port with no laycan is a forward-arrival offer wearing a spot price. Have your freight forwarder confirm the sailing. |
| 3. Realistic ETA | “Give the discharge port ETA, the number of transshipments, the carrier operating each leg, and your estimated clearance date.” | An ETA with no legs or carrier named is a schedule read off a website; the reliability data above says why. Check the discharge port’s wait in the Kuehne+Nagel bulletins and budget clearance days. |
| 4. Payment terms | “State what is payable before the goods are on the water, and which documents release each payment.” | Full payment in advance against a cargo with no laycan puts your working capital on a vessel nobody has named. A supply credit line that pays after your operating cycle removes that line entirely. |
| 5. Delay contingency | “State the remedy if the cancelling date passes: price adjustment, replacement volume from local stock, or cancellation without penalty.” | Silence, or force majeure boilerplate covering only the seller. The strongest answer names stock already sitting in an integrated logistics center near your plant, with inland delivery attached. |
Compare on one Incoterm, not on whichever each seller prefers. Under CFR and CIF the seller books the freight but risk still passes to you at loading, per ICC Incoterms 2020. An FOB price with no named vessel hands you the freight market and the delay.
Score the sheet, not the price. A seller who answers all five in writing is quoting a cargo; a seller who answers two is quoting an intention. That gap is measured in weeks of production.
That is the reset July 2026 forced on buyers: less risk at a fair number, not the lowest one on the sheet. Which origins can answer all five is what the sourcing map below settles.
Where to Source PE in H2 2026: An Origin-by-Origin Delivery Map
Four origins can realistically land polyethylene at your plant in H2 2026: China re-export, the US Gulf, the Middle East, and stock already cleared inside your own customs territory. Each prices differently because each carries a different arrival risk — ocean-leg length, transshipment count, and how much of that risk someone else has already absorbed for you.
The sheet only works if there is a real cargo behind every line. Here is what is available to fill one.
| Origin | Supply position, 2026 data | Ocean leg to Latin America | What it costs you on the delivery sheet |
|---|---|---|---|
| China re-export | ~550,000 t of PE exported in April 2026 alone, +479% y/y (ChemOrbis) | Shanghai–Santos runs ~30–38 days, plus 5–10 more when the box transships once or twice (Sino-Shipping) | The longest ETA to interrogate. Only on-water cargo with a confirmed laycan gives you a hard arrival window — book the leg with a freight forwarder who tracks the transshipment call, not just the sailing. |
| US Gulf | North America shipped ~36% of global PE exports in 2025 (~15.5M t of ~43M t) at above 90% utilization (ITP) | The shortest deep-sea route into Brazil and Mexico; freight on the lane barely moved through the spring crisis wave | Some plants are near sold-out, so allocation beats price. Brazil’s antidumping duty belongs in your landed cost line, cleared through customs clearance as a known number. |
| Middle East | 12.5M t of PE exported in 2025, 42% of the global total — but ~84% of that capacity depends on the Strait of Hormuz (ICIS via IOM3) | Repriced weekly; routing and war-risk decisions sit with the carrier, not with you | The origin where an FOB price tells you the least about when the resin arrives. |
| Stock already in your country | Bonded or duty-paid inventory at destination — no ocean leg left to run | Zero days at sea; delivery measured in truck hours | Highest cost per tonne, lowest delivery variance. Held in integrated logistics centers and moved by domestic transportation. |
Is China re-export PE reliable?
On volume, yes. China exported roughly 550,000 t of PE in April 2026 alone, up 164% month on month and 479% year on year, while its import-export gap narrowed to the lowest level on record, per ChemOrbis. What you accept in exchange is the longest ocean leg on the board.
The volume is not a one-month accident. Cumulative January–April exports reached 1.3 million t, up 122% y/y, including 128,000 t into Latin America (more than double the year before) and 838,000 t into Asia-Pacific, per ITP. Brazil takes about 5% of monthly Chinese PE exports.
The structural read matters more than any single month. ICIS analyst John Richardson forecasts China HDPE exports at 1.7 million t in 2026 against 503,571 t in 2025 — more than triple — while domestic HDPE capacity grows only 6%, to 17.5 million t/y. Exports are outrunning capacity growth by a wide margin, which is how a structural trade flow announces itself.
Much of that material moves through bonded warehousing, where cargo sits under customs control and can be re-exported without entering the domestic market. That widens the pool a trader can offer you and leaves the voyage exactly as long as it was. Ask which vessel your tonnes are on before you treat the wider pool as an earlier date.
Can US Gulf PE backfill Middle East supply?
Not completely. Harrison Jacoby, Director of PE at ICIS, told IOM3 in March that “the US would fall short of completely backfilling 100% of Middle Eastern exports.” North America accounted for ~36% of global PE exports in 2025 against the Middle East’s 42%, and its plants already run above 90% utilization, some near sold-out.
New tonnes are coming. Golden Triangle Polymers, the Chevron Phillips Chemical–QatarEnergy joint venture in Orange, Texas, starts up 2 million t/y of export-aimed HDPE in H2 2026 — against roughly 4 million t/y of new PE capacity starting in Asia the same year, chasing the same demand.
What the US Gulf actually sells you is a short lane. Through the March–April crisis wave, Houston–Santos freight rose just $12/t while China–UAE spot freight jumped around 25%. Fewer sea days means fewer places for a schedule to break.
The duty is the trade-off, and it is knowable. Brazil finalized five-year antidumping duties on PE in late March and April 2026 at $199.04/t for US-origin and $238.49/t for Canadian-origin resin, after a recalculated rate as high as $734.32/t was rejected as commercially prohibitive. A fixed $199.04/t you can model beats a discount you cannot schedule.
What does resin already in your customs territory buy you?
It buys the removal of the ocean leg, and with it most of the variables that make a landed cost estimate wrong. No laycan to slip, no transshipment to miss, no war-risk surcharge applied mid-voyage. You pay a premium per tonne and you get an arrival date measured in truck hours instead of sailing weeks.
The premium is easier to justify once you accept how long this has to run. Freight forwarders said so in June, before July’s escalation:
“If the strait opened up tomorrow, then supply chains could return to normal some time in the first quarter of 2027. … The second another missile fires, no ocean carrier is going to put their vessel through there again and risk that.”
— Lynn Stacy, Managing Director, OEC Group Liquid Logistics Solutions, ICIS, June 18, 2026
An alternate origin can also vanish faster than you can re-qualify a grade. Saudi PE flows into Brazil nearly tripled year on year through late 2025, then collapsed to roughly a third of their spring-2025 peak by March 2026. Last quarter’s origin mix does not automatically protect this quarter.
Run all four origins in parallel and the question your sourcing desk answers changes: not who is cheapest this week, but which cargo is physically closest to your line, and what that difference is worth.
How Syntex America Covers Every Line on the Delivery Sheet
Syntex America answers all five delivery-sheet confirmations under one contract: we trade the resin, book the ocean freight, clear the customs entry, hold stock near your market and run the inland leg to your plant. One counterparty owns the arrival date, and one phone number answers for it.
The sourcing map above narrows the origins. Here is what each line of your delivery sheet looks like when we are on the other side of it.
| Delivery-sheet line | What we put behind it |
|---|---|
| Origin, producer, grade code | Our trading desk qualifies the producer and approves the grade against your actual property block. PE grades are quoted with the producer named, never as generic “HDPE.” |
| Load port and laycan | Freight forwarding through partners with their own offices in the main ports, running weekly LCL and FCL consolidations — so the laycan on your sheet is a booking, not an intention. |
| Realistic ETA | Satellite-linked cargo monitoring to the plant gate, and customs clearance filed ahead of arrival so the entry does not add the week. |
| Payment terms | The Resin Supply Credit Program: you pay after your operational cycle, so arrival timing stops competing with your cash position. |
| Delay contingency | Integrated logistics centers holding stock close to your market — the cover that turns a missed vessel into a scheduling problem, not a stopped line. |
How the Resin Supply Credit Program works
In three steps. Syntex supplies resin against your demand; you receive it, process it and sell the finished product; you pay after your operational cycle closes. No upfront payment, and no container sitting on your balance sheet earning nothing while it waits for a production slot.
- We supply. The grade you specified, from the origin you approved, on the laycan we confirmed. PE, PP, PVC, PET and CaCO3 masterbatch move on the same structure.
- You produce and sell. The material goes to the line; your working capital stays on tooling, payroll and the next order.
- You pay after your cycle. Payment lands once your own customers have paid you. Lines start at USD 50K–150K and reach USD 500K+ for recurring clients, growing with payment history.
Approval looks at the operation, not a credit score alone: track record, monthly consumption, installed capacity, client portfolio, banking references. And inventory you have not paid for carries no financing cost, so the annual carrying charge priced into the landed-cost math above drops out of your arithmetic.
Send us the delivery sheet, not the price sheet
Tell us the grade, the volume and the week your silo runs low. We come back with a named producer and grade code, a load port and laycan, a landed cost to your door, and payment after your operational cycle — on polyethylene and the wider thermoplastic range.
Get a structured proposal in 24 hours → Talk to our trading team
572 converters in 18 countries source through us. If your next cargo has an arrival week you cannot miss, give our trading team the date first, the price second.
Credit program · Freight forwarding · Customs clearance · PE polyethylene · About us
Frequently Asked Questions
A laycan — laydays and cancelling — is a two-date window: the earliest day a vessel may present at the load port, and the cancelling date after which the charterer may cancel or renegotiate. In a resin RFQ it is the one field that gives your seller a date to miss. “Shipment within 30 days of payment” is not a laycan.
Compare offers on CIF or CFR rather than FOB alone, but know what that buys you. Under all three Incoterms 2020 rules, risk transfers to you the moment the goods are loaded at the origin port. CFR and CIF only change who books the freight and who pays for cargo insurance. The delay stays yours.
Add every cost between the seller's gate and your extruder: material price, ocean freight and surcharges, duties and taxes, insurance, clearance and documentation, inland delivery, and the capital tied up while the cargo travels. The add-ons buyers leave off the quote commonly total 3-8% on top of an FOB price. Divide by tonnes, then compare offers on that number.
Because crude reprices in seconds and polyethylene reprices in shipments. Brent ran from $100.69 on July 23, 2026 to $82.82 intraday on July 28 and back to $90.74 on July 29, while Japan naphtha gained about 27% on the month and Reliance raised Indian PE list prices effective July 27, after crude had already turned down.
Shanghai to Santos typically runs 30-38 days at sea, and one or two transshipments add another 5-10 days. Discharge, customs clearance and the inland leg come after that. Only an on-water cargo with a confirmed laycan turns that range into an arrival window you can schedule production against.
Five confirmations, in writing: the producing plant, brand and exact grade code; the load port and a laycan with a cancelling date; a discharge-port ETA naming transshipments and carriers; what triggers each payment; and the remedy if the cancelling date passes. Score sellers on those answers, and compare them all on one Incoterm.


